

Digital Maturity Index 2025: assessment of the evolution of the digitalization of local administrations


A few years ago, the great challenge for local administrations was to digitize procedures. So that citizens could interact electronically with the city council. Today this objective has practically been achieved.
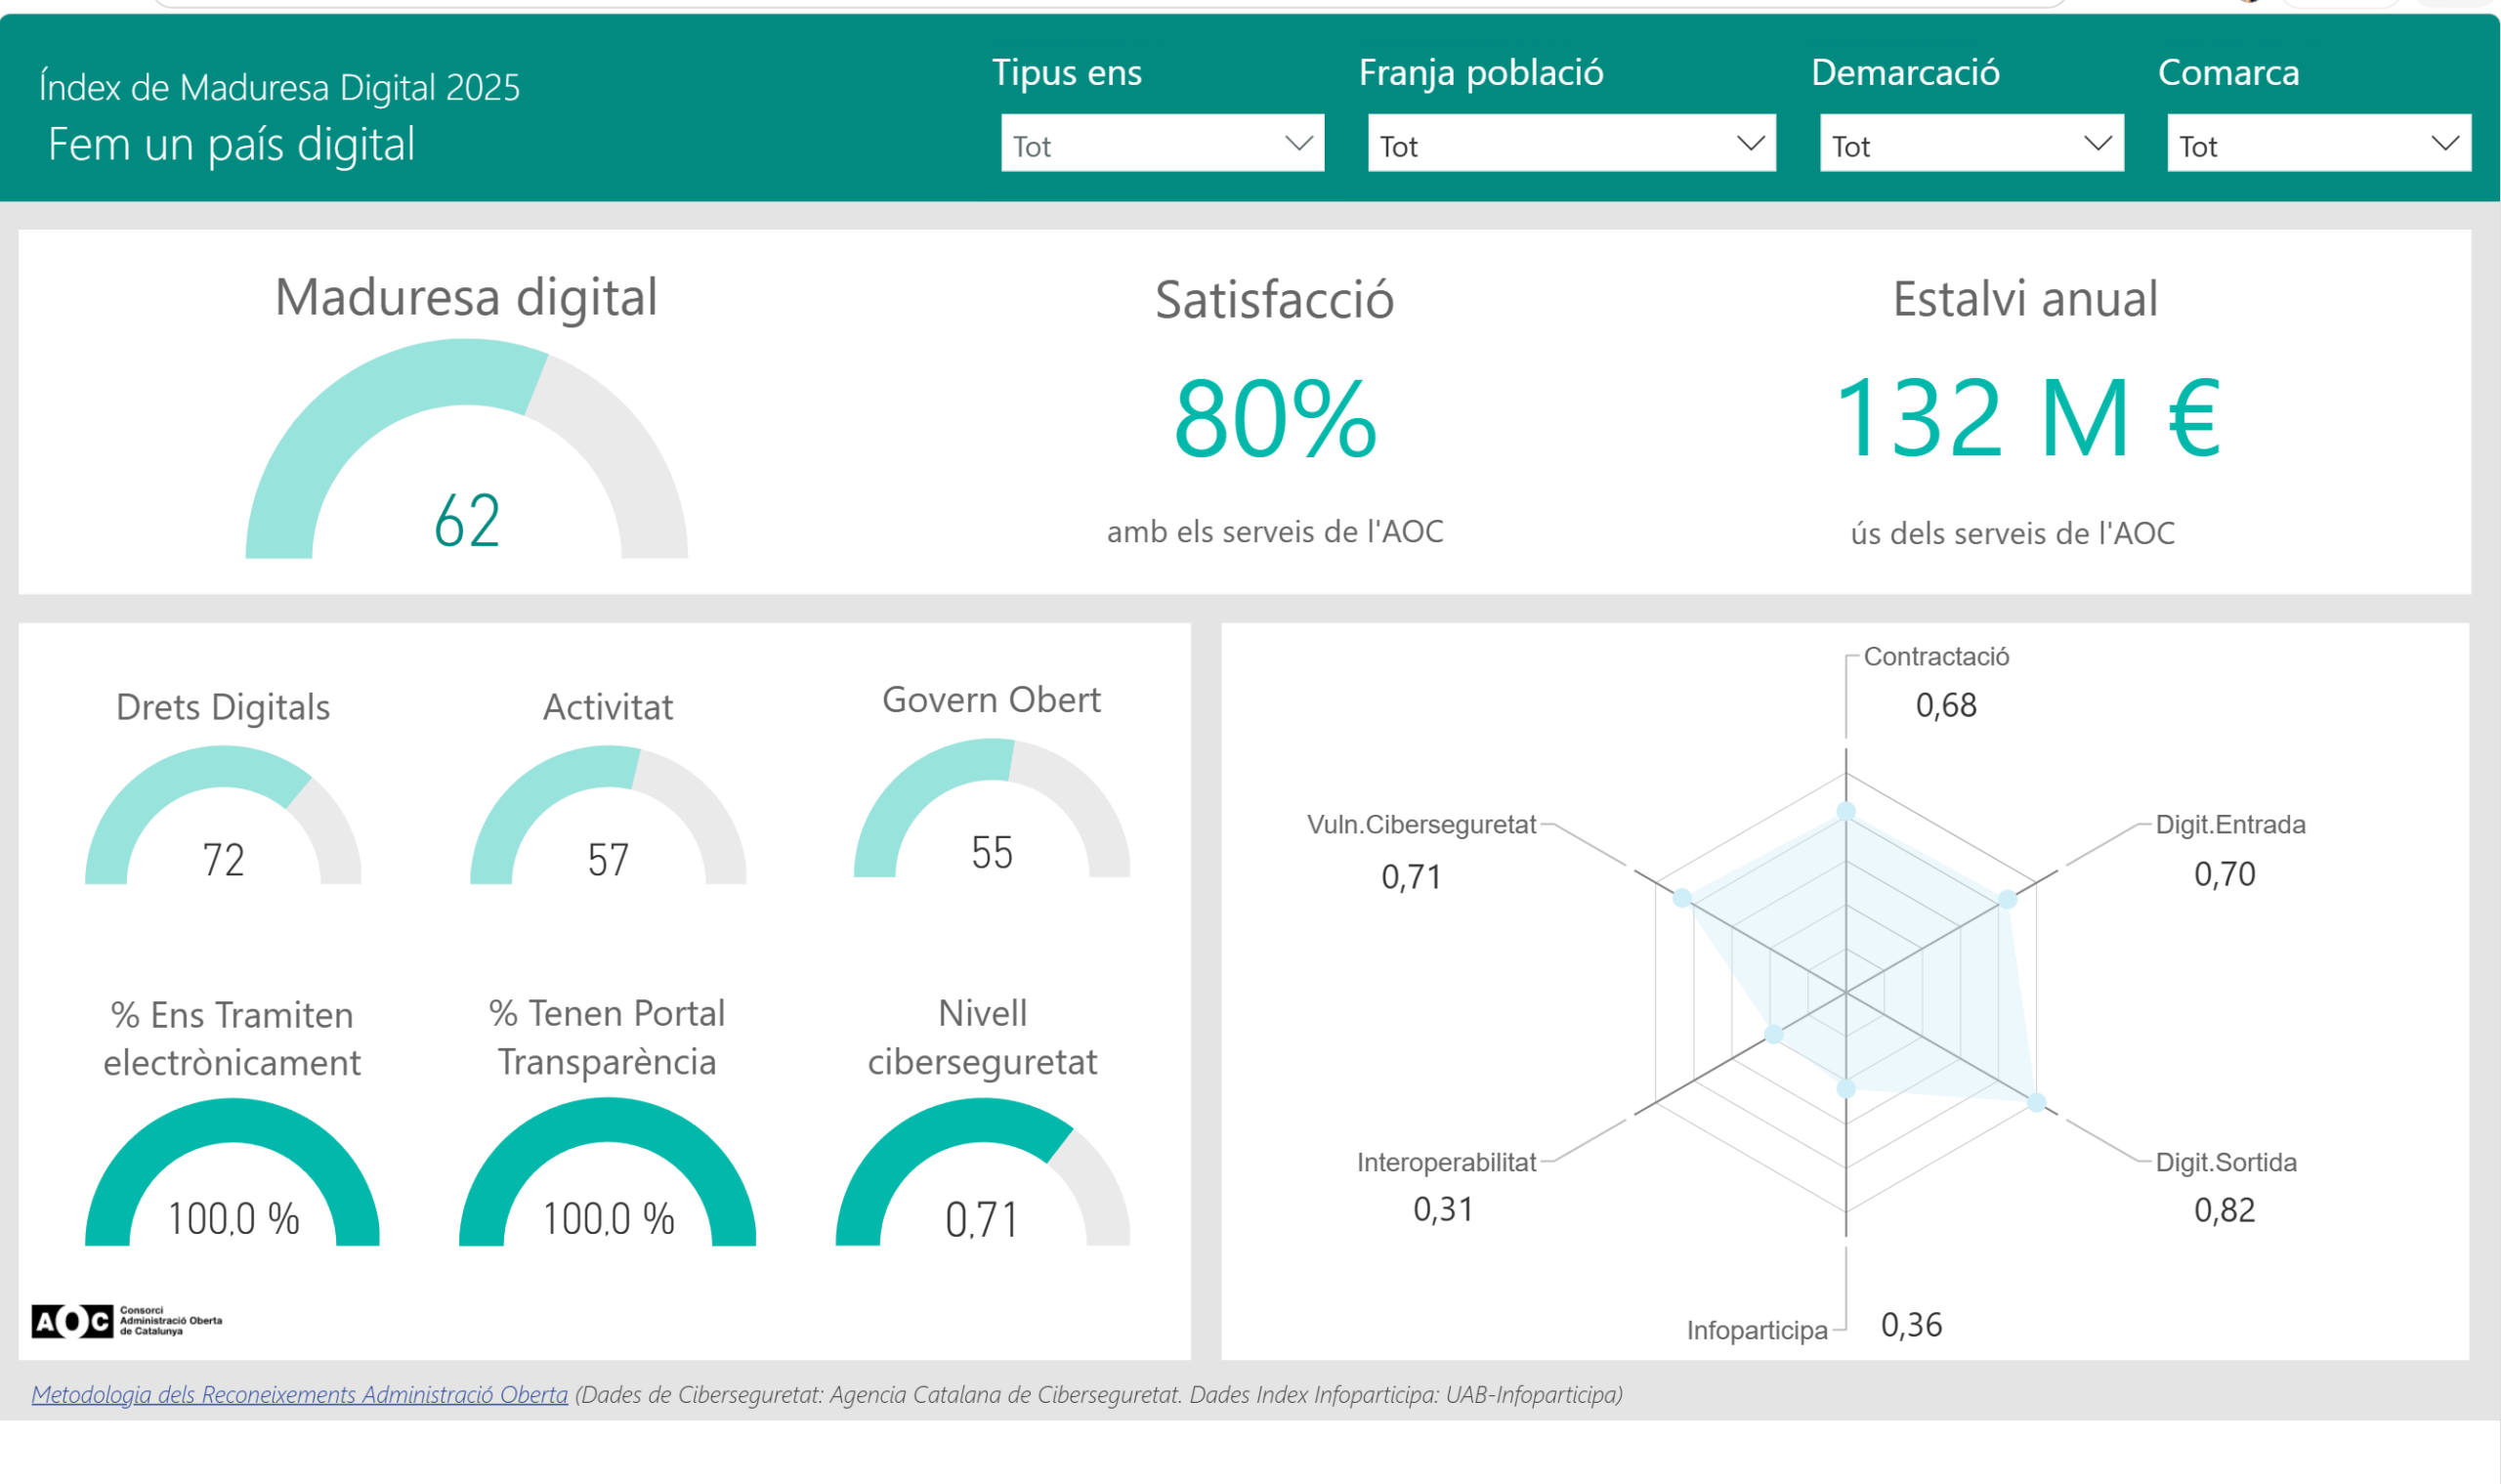
Data from the Digital Maturity Index (DMI) 2025 shows that the digital transformation of local authorities continues to advance. But they also indicate a deeper change: After years of digitizing procedures and deploying services, administrations are beginning to integrate systems, reuse data and automate processes..
The average IMD score reaches 62 points, the highest value since the index was calculated. But the most significant data is another. The median stands at 62,2 points, almost four points above the previous year.. This means that the improvement is widespread. It is not just the leading entities that advance. It is the local world as a whole that continues to progress.
The digital rights dimension continues to be the one that obtains the best results. The basic layer of digital services is practically universalized. 100% of the entities have a generic instance and citizen folder. The web search engine also reaches 100%, the registry in Via Oberta at 94% and the accessibility seal at 97%. In other words, essential digital services are now part of normality to Catalan local administrations
Cybersecurity also continues to improve. The average score of the cybersecurity index is 71%, two points more than the previous year. 81% have a data protection officer, and 86% use e-government platforms certified with the National Security Scheme. On the other hand, very few of us still have our own ENS certificate. Only 11 entities have obtained it, since proving compliance with the ENS with our own systems and infrastructures is a complex and demanding process.
The most advanced indicators continue to evolve, although at a slower pace. The electronic registration of powers of attorney reaches 30% and electronic administration ordinances reach 46%. The exception is compliance with the National Interoperability Scheme (ENI). In just two years it has gone from 6% to 70%.
For years, interoperability has been one of the areas with the most room for improvement. Many of us had the services available, but used them little. And when we did use them, it was often manually. This year we are seeing a change in trend.
60% of local authorities have made at least one consultation Via Oberta during 2025. It is a figure that continues to grow year after year: it was 49% in 2024, 43% in 2023 and 40% in 2022. The intensity of use is also increasing. The average percentile of queries in Via Oberta with respect to the optimal value it goes from 30% to 38%, the best result in the last six years.
But the most important change is not quantitative, it is qualitative. 51% of local authorities have carried out interoperable queries in an automated mannerInteroperability is no longer an occasional practice and becomes part of the regular operation of administrations. Data is automatically retrieved when necessary, without manual intervention.
Moreover, this is a transversal change. Municipalities with fewer than 500 inhabitants already have a level of automation of 31%, while in municipalities with more than 50.000 inhabitants it reaches 87%. This is probably the clearest sign that digital transformation is entering a new stage.
The open government dimension has achieved the best result in the last five years. The average score reaches 55 points and registers the highest annual growth of the three dimensions.
The Infoparticipa indicator rises to 36%. Open data initiatives go from 6% to 11% and almost half of local entities now have an ethical mailbox. These are positive results that show a favorable evolution.
However, continues to be the dimension with the lowest scores and the greatest differences between administrations. Municipalities with fewer than 500 inhabitants obtain an average score of 48 points. Those with more than 50.000 inhabitants reach 90 points. The difference is 42 points.
The conclusion is clear. The technology is now available to everyone. The challenge now is to keep information up to date, improve internal processes and consolidate a culture of transparència and accountability.
Most local authorities continue to progress. Those that improve increase their score by 6,5 points on average. Those that regress do so by 4,2 points.
The number of leading entities is also increasing. Those who exceed 75 points go from 10% to 15%At the same time, however, the percentage of entities located in the lowest levels of digital maturity is also growing. The difference between large and small municipalities remains one of the main structural challenges. Municipalities with more than 50.000 inhabitants obtain an average score of 82 points. Those with less than 500 inhabitants are at 56 points.. Both groups are improving. But the gap remains significant
Check your report at the Digital Maturity Index 2025. Compare yourself with municipalities of similar size. Identify where you can improve and ask for support if you need it.
Because digital transformation is not an arrival point. And the data — when looked at carefully — always tells us where to go.