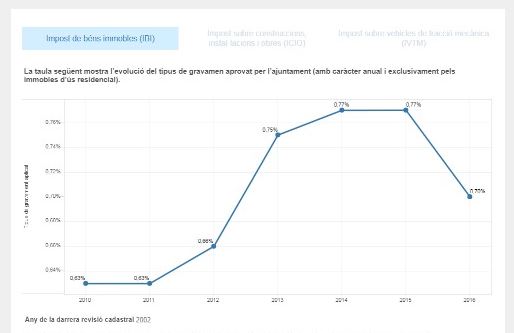
In the latest version of the portal transparència Work has been carried out to improve different items with the incorporation of associated graphics and partial data downloads. A good example of these improvements is the case of the item "Tax rates"Where different graphs have been implemented that provide more information on the percentages or amounts that the entity applies in different taxes such as the real estate tax (IBI), the tax on construction, installations and works (ICIO), or IVTM, as shown below:
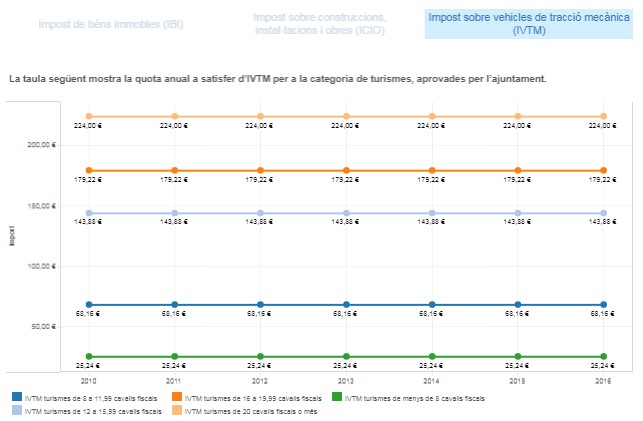
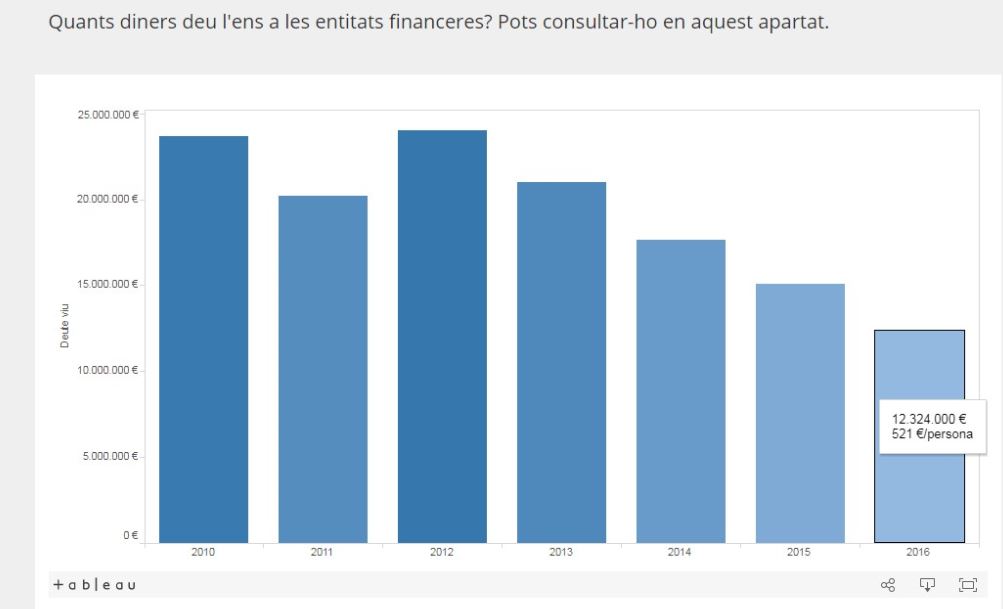
It should also improved the graph associated with indebtedness in the economic management section, making it more homogeneous in color and indicating the debt per capita, as shown below:
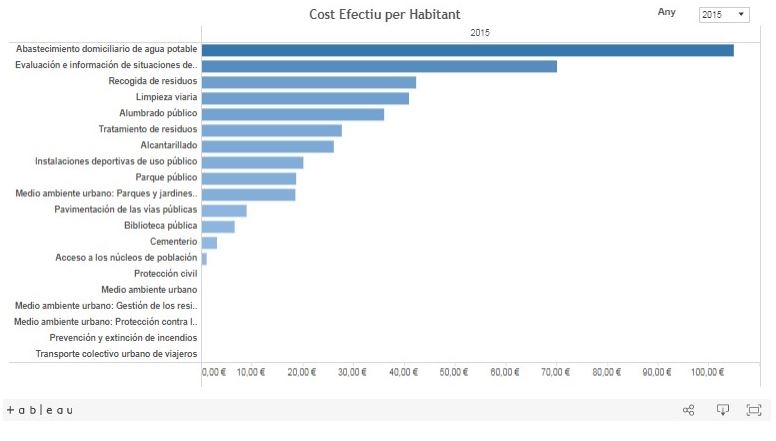
Another item where a chart is implemented is the "Effective cost of services”, Based on the information in the official MINHAP publication (only in Spanish), which includes the information in absolute terms and per inhabitant according to the obligation of all local entities to calculate it before November 1. of each year, based on the data contained in the settlement of the general budget and, where applicable, on the approved annual accounts of the entities linked to or dependent on it, corresponding to the immediately preceding financial year.
Finally it should be noted that To activate these new charts you need to change the settings of the item making them visible from the editing portal (with the corresponding permissions), because by default they are deactivated. You can find more information about using the portal at the edit level at service support portal transparència.



