

E-government services are used by 72% of EU citizens


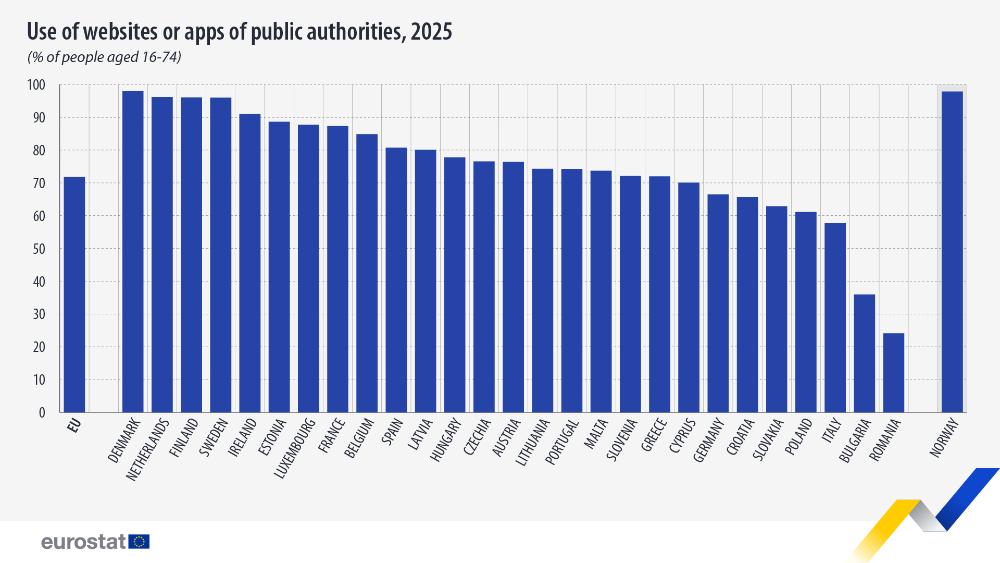
In 2025, 71,9% of European Union (EU) citizens aged 16 to 74 used public authority websites or apps, an increase of 1,9% compared to 2024 and 4,3% compared to 2022, the year in which data collection began.
The EU countries with the highest acceptance of e-government services were Denmark (98,0% of people used public authority websites or apps), the Netherlands (96,2%), Finland (96,1%) and Sweden (96,0%). On the other hand, Romania (24,1%), Bulgaria (36,0%) and Italy (57,7%) recorded the lowest percentages. In Spain the percentage stands at 80,7%, above the EU average (71,8%).
The most common use of e-government services was to obtain information about services, benefits, laws, opening hours or similar topics (44.2%). Accessing personal information was the second most common activity (41,3%) and filing tax returns was the third (38,2%).
EU citizens also use e-government services to make an appointment or reservation (38,1%), download or print official forms (36,7%), receive official communications or documents (36,6%), request official documents or certificates (20,8%), access public databases or registers (20,7%), and file complaints (5,7%).
In 2025, the highest percentage of people who reported having used their electronic identification in the previous 12 months to access services provided by public authorities or public services in their own country was found in the Netherlands (95%), followed by Finland (86%), Estonia (85%) and France (84%). The EU average was 46%. Spain, with 52%, is above the European average.